
Connect Spending to What Works with Real-Time Analytics
Districts dedicate substantial resources to professional development, coaching, curriculum, and instructional tools to support educators and improve student outcomes. However, without clear links between investments and results, understanding true impact is challenging. Our advanced Return on Instruction (ROI) algorithm—designed by experienced education consultants—connects participation, cost, and performance data, empowering district leaders to make informed decisions that best support their schools and students.
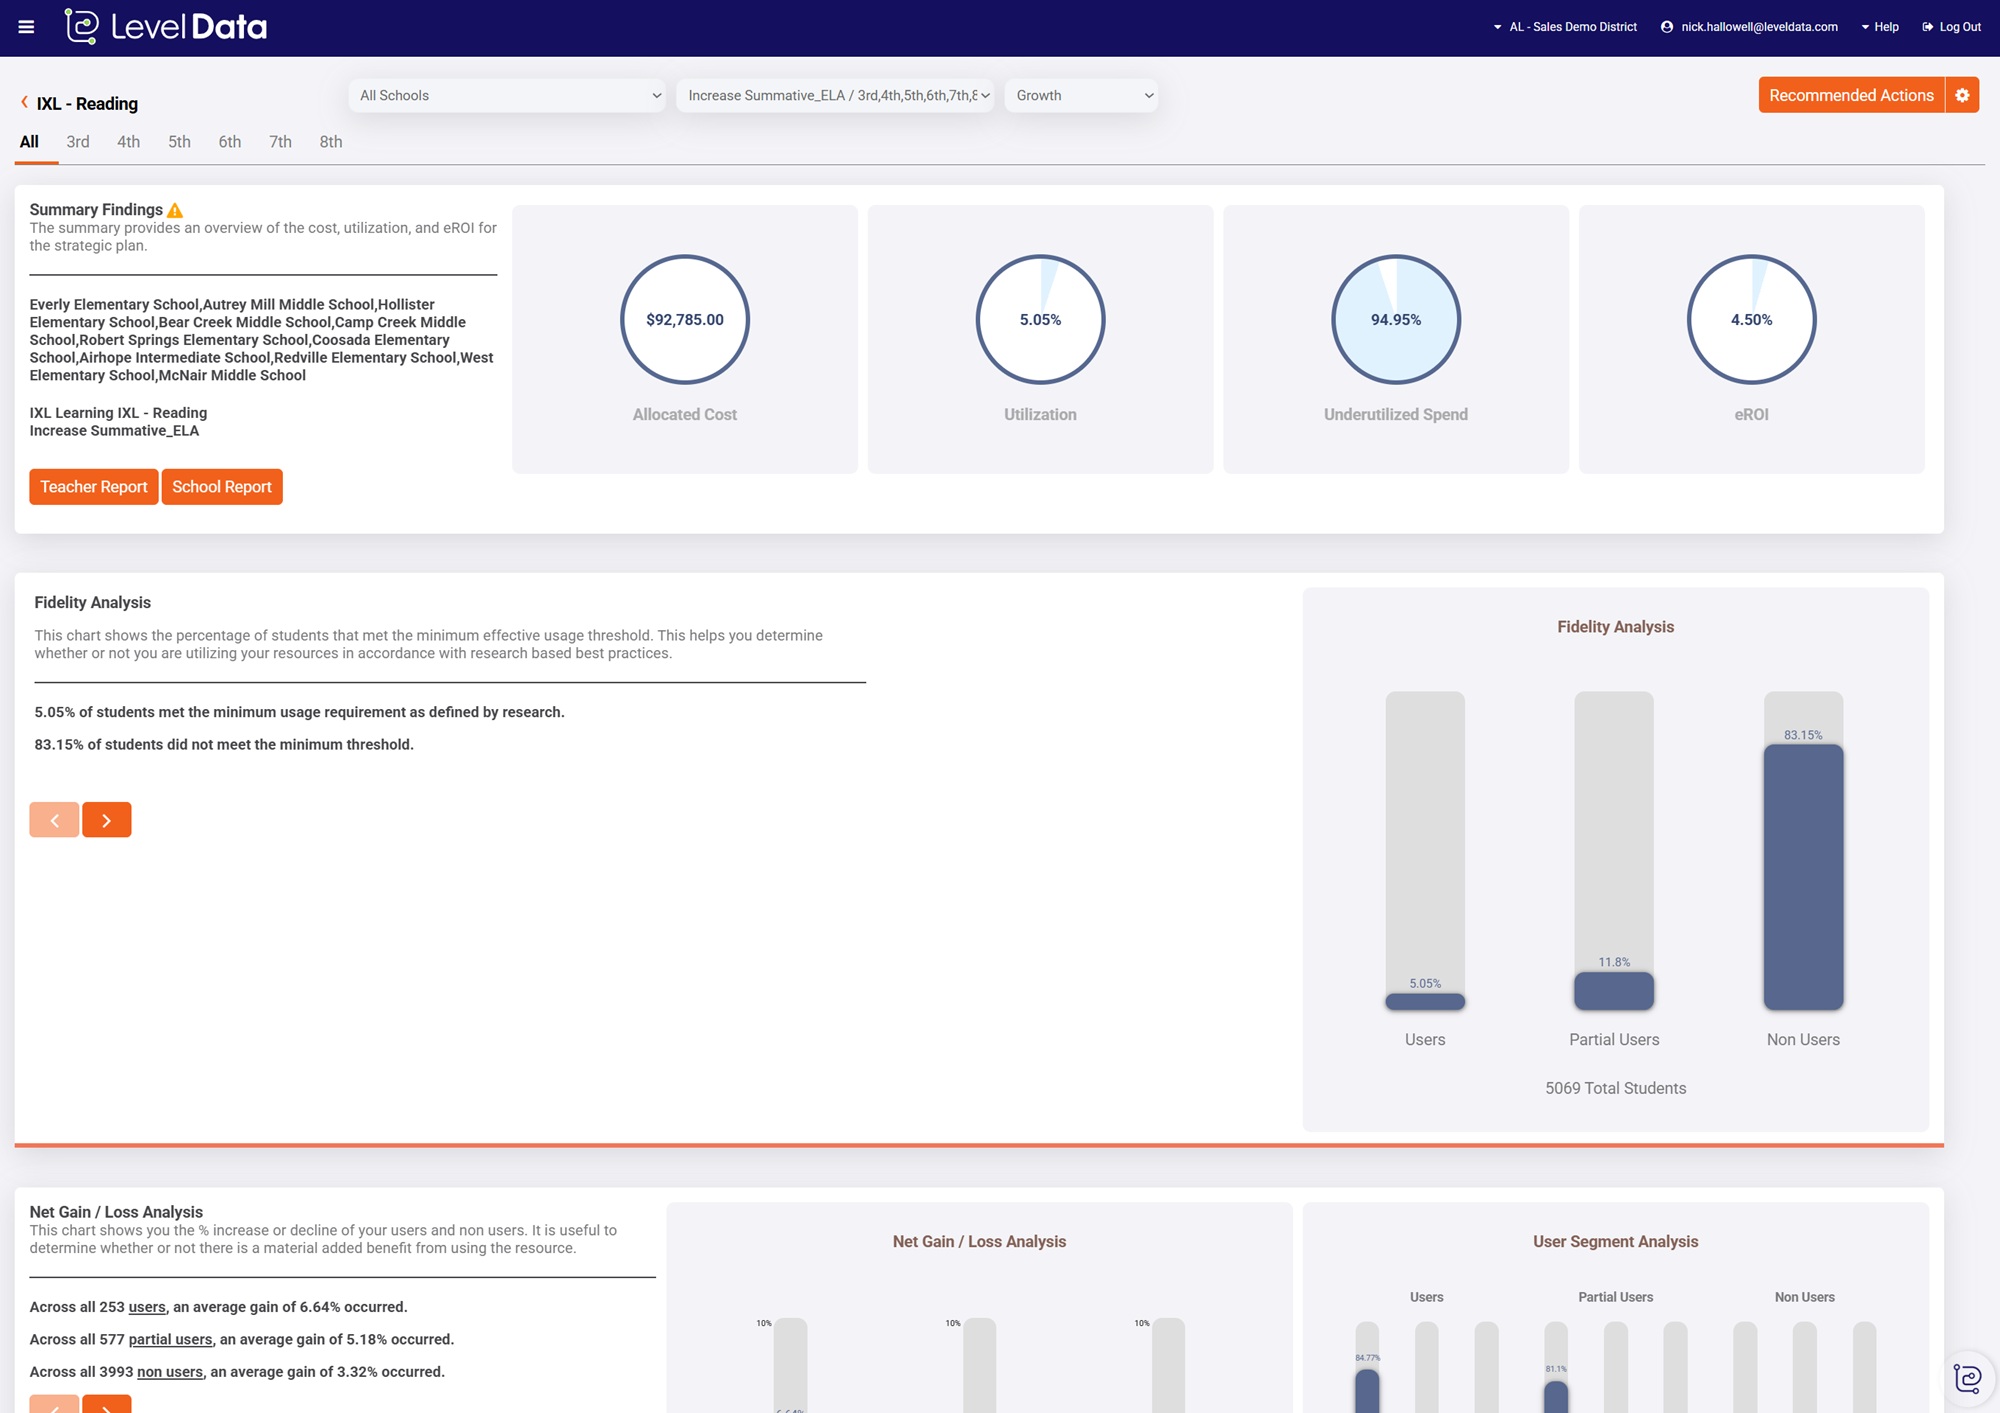
Visualize Usage, Impact, and ROI in One View
Uncover how instructional investments are driving outcomes by visualizing product spend alongside student utilization and growth to identify what’s working — and what’s not. Pinpoint underutilized tools, highlight classrooms making the most of their resources, and quantify return based on actual learning gains.
Connect Professional Development to Student Outcomes
Your educators are your greatest lever for student success, and now you can see exactly how your investment in their development is paying off. The Educator Supports Module connects professional development and coaching activity directly to student outcomes so you can make sure every future professional development dollar counts.
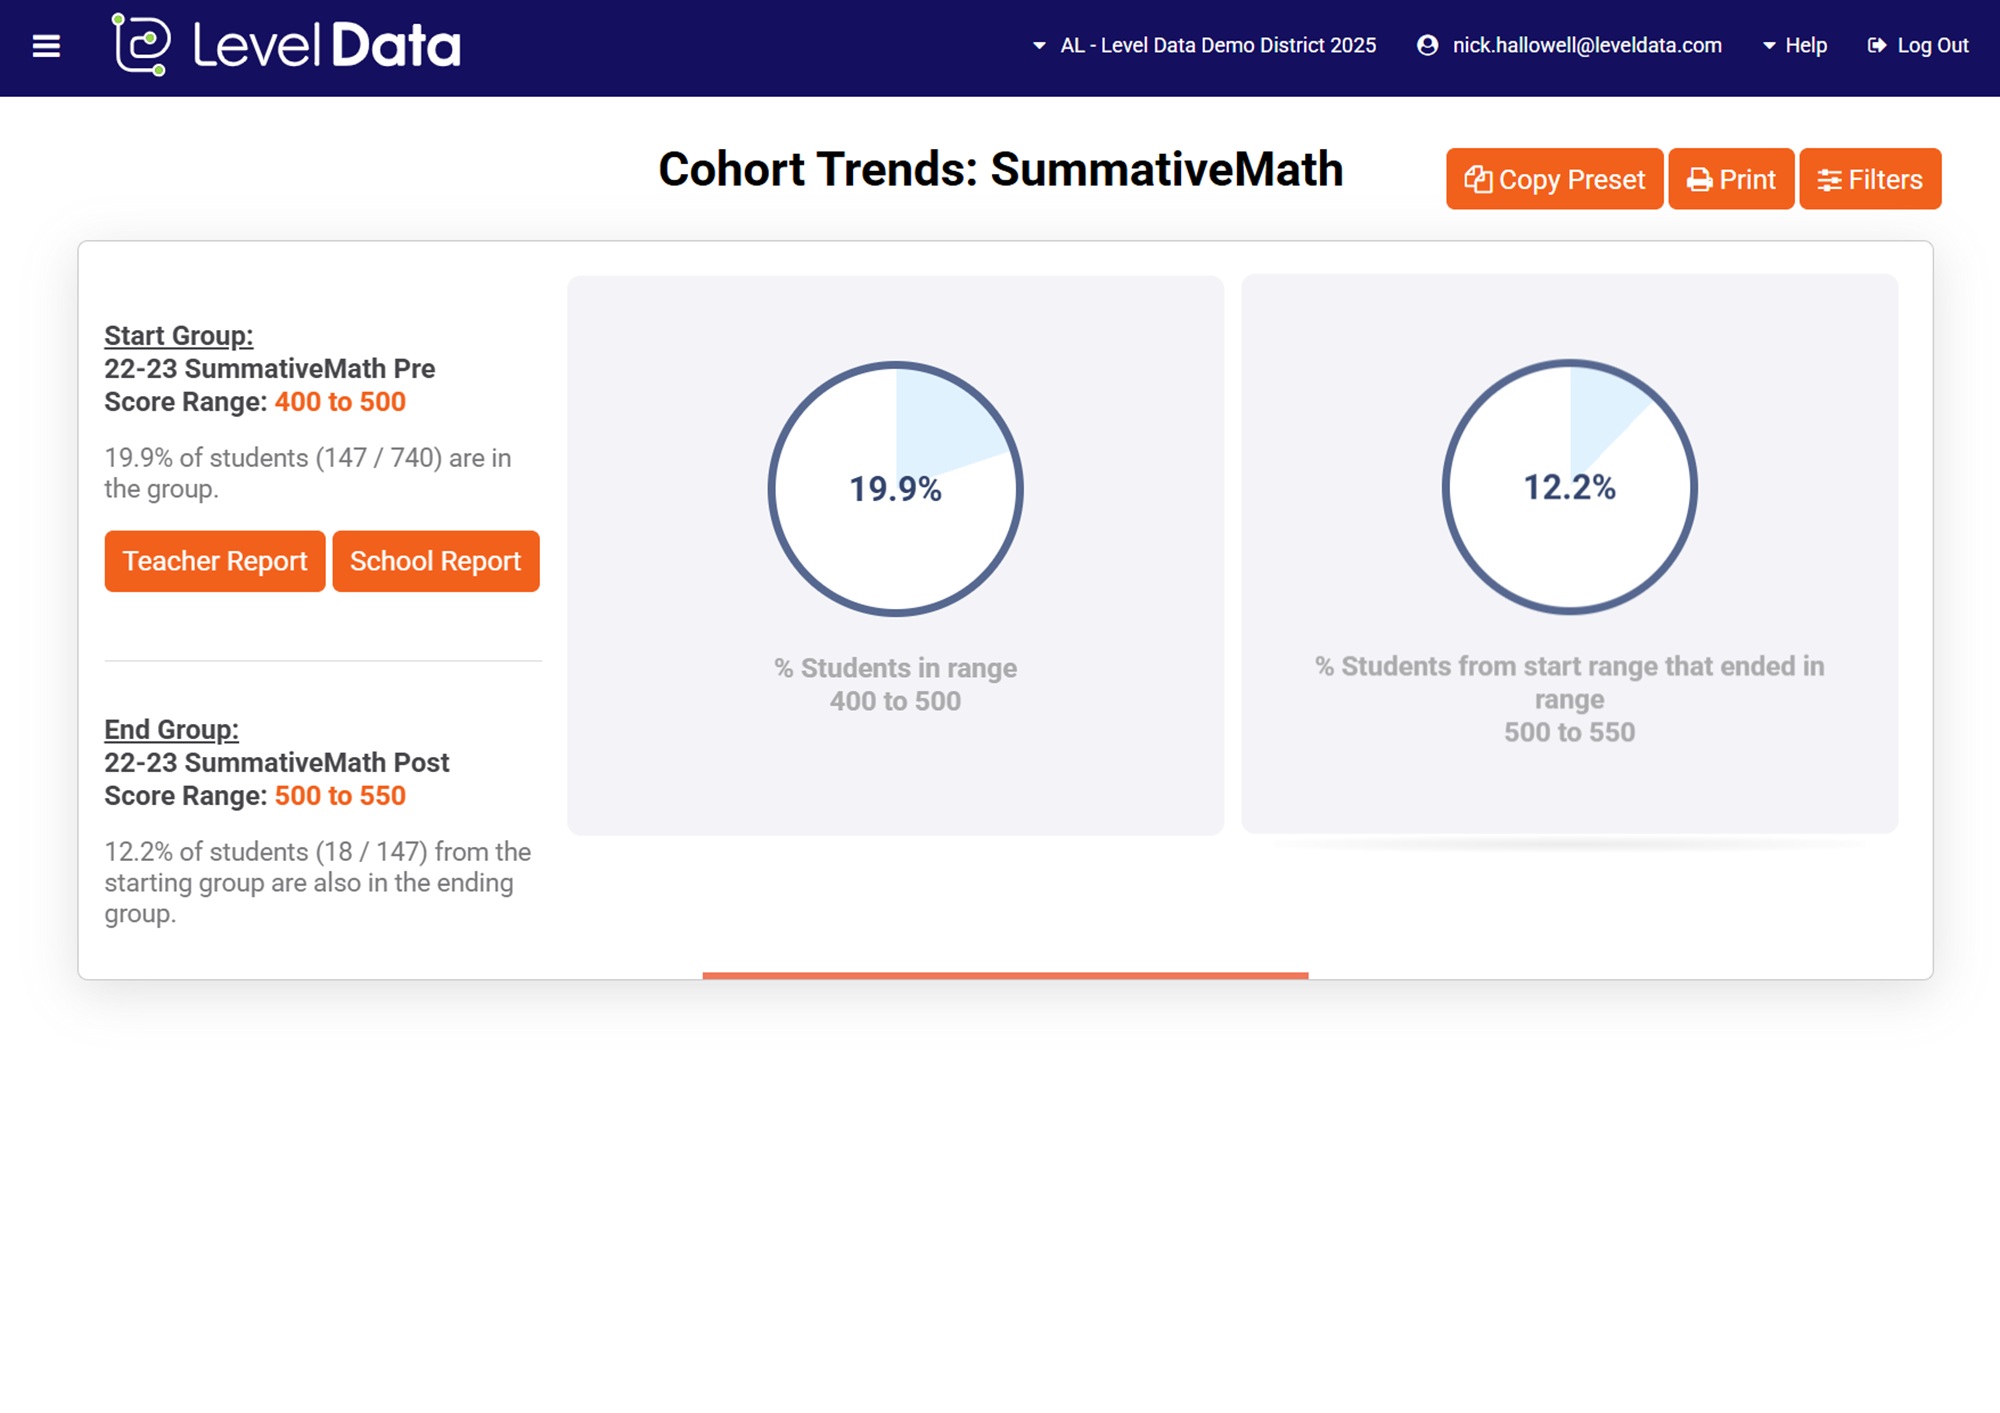
Drive Continuous Improvement with Subgroup Performance Insights
Whether you’re tracking progress for multilingual learners, students with disabilities, low-income students, or any other federally recognized subgroup, ROI helps district teams disaggregate outcomes and gain insight into trends and gaps in access, engagement, and outcomes by cohort, grade, or program.
See the Full Picture of Your Educational ROI
With Return on Instruction, district leaders and cabinet members get a powerful, all-in-one hub that unites data from every system and program—digital or not—to instantly see which investments are driving student success. With smart analytics that track the real-time performance of dollars spent, every member of your leadership team gains line of sight into what is working and for whom.
Are You Getting the Full Return on Your Educational Investments?
Book time with us to see how you can tie your investments in professional development and districtwide resources directly to student outcomes, so you can measure impact, justify spend, and make smarter funding decisions.