Perhaps your district received last year’s state assessment results, and the scores are disappointing. Or maybe your student services team noticed a significant increase in the number of students receiving Tier 2 or even Tier 3 academic support.
Whatever the circumstances, when there is a concerning change in student achievement, you and countless other instructional leaders have likely asked yourself: Is the problem in our curriculum or in our instruction?
Rarely is the root cause of any shift in student achievement one-dimensional. Yet you still must make a concrete, informed decision about how to course-correct such patterns with limited resources.
This is where understanding your educational return on investment (eROI) becomes critical.
What is eROI?
eROI measures how program or resource costs and usage correlate with student achievement. Sometimes called “return on instruction” or “academic ROI,” eROI helps leaders quantify the impact of everything from professional learning for teachers to curricular programs to after-school programs.
Let’s explore four strategies for using eROI to answer this key question and help you take a data-informed, human-driven approach to allocate your resources to improve student achievement.
1. Ask the right questions first
When faced with an issue, it can be tempting to dive headlong into data in search of an answer. But that is about as effective as blindly running down a path without a map or compass.
Instead, before even touching a data dashboard, ask yourself the right, targeted question(s). From there, you’ll know exactly what data you need to review and clarify your understanding of the problem. Only then can data support you in creating a solution.
Let’s take the example of low scores on state reading assessments. The questions below demonstrate how to deepen your investigation and isolate whether curricular or instructional patterns lie behind the problem:
- What characteristics can we identify in the lower reading scores? For instance, are they concentrated in particular schools, grade levels, or even classrooms?
- Are there any patterns with low reading scores among particular student groups, such as students with IEPs or of specific races/ethnicities? What about proficient or above-proficient scores?
- Are there specific state standards that correlate with consistently low scores? Which standards?
- Which curricular programs are available to students who performed poorly on state reading assessments? What does their usage of these resources look like as compared to their peers who achieved higher scores?
- What instructional supports do our teachers have for literacy, such as coaching, professional learning communities, peer mentorship, etc.?
This exercise may feel overwhelming at first, but with practice, this foundation sets you up for future data analysis and decision-making success.
The eROI connection
Unlike in business, where ROI is a simple ratio of costs and profits, eROI requires a more nuanced approach. After all, as important as funding is, student learning outcomes are the real “profit” to maximize. By asking these questions upfront, district leaders investigate achievement concerns with greater intentionality and critical thinking.
2. Look at achievement across multiple measures and dimensions
Even with clear guiding questions on hand, many leaders make the mistake of focusing on only one measure of achievement, usually the one showing undesirable trends.
Let’s continue with the state reading scores example. Rather than looking at state assessment reading scores in isolation, compare them with both district assessment scores and grades. Then go deeper by reviewing patterns in these achievement measures across multiple levels, from district to classroom.
Reviewing all three measures of achievement can reveal discrepancies or consistencies that help you understand if curricular changes or instructional improvements would help change scores.
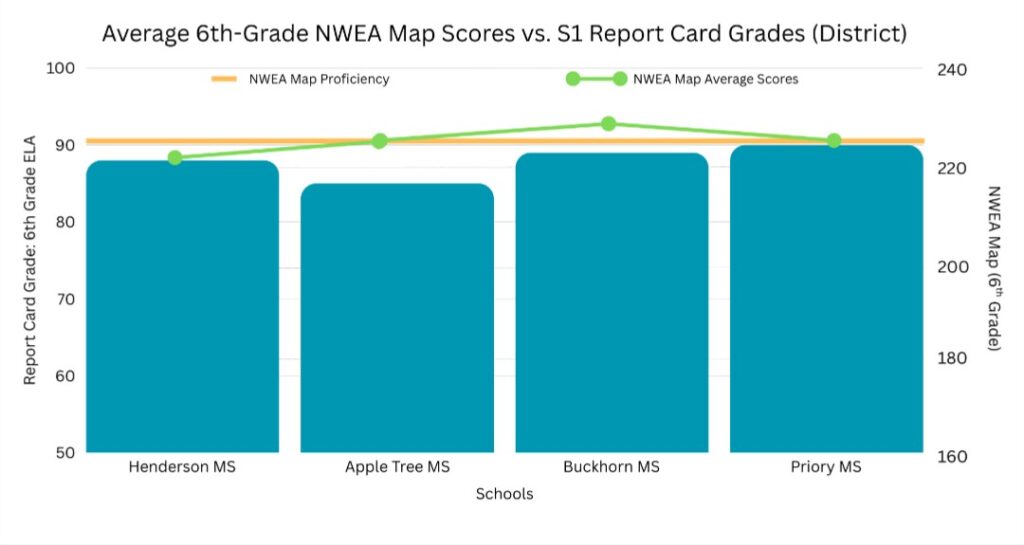
For instance, you might discover that many general education students in the district who scored poorly on state assessments actually received As and Bs in Language Arts or similar content areas and met the latest proficiency benchmarks on your district assessments. This is a strong clue that the curriculum, or your district assessments, may not fully align with the skills and standards assessed by the state.
On the other hand, discrepancies across district, and state assessments, and letter grades concentrated in particular classrooms or grade bands may indicate instructional opportunities to improve achievement. Rather than spending time investigating the curriculum, you might offer coaching or professional learning to improve evidence-based teaching practices or reduce grading deflation/inflation instances.
The eROI connection
Discrepancies and parallels across multiple kinds and dimensions of achievement data, as well as eROI, offer clues as to where opportunities to improve student learning may lie—and where to put your district’s limited funding and taxpayer dollars for the greatest impact.
Did you know? Grow by Level Data streamlines instructional coaching activities for teachers, coaches, principals, and district leadership, ensuring that this major investment in your staff yields positive student outcomes. Learn more.
3. Examine relevant usage and funding data, too
Once you have greater clarity about the trends in student achievement, you can then turn your attention to the programs, resources, and activities behind them. But be sure to analyze not only the usage of each investment across schools but also their actual costs to your district.
Consider these factors as you review district investments related to the concerning pattern in achievement:
- Availability: Do certain campuses, classrooms, or grade levels have access to particular resources (such as digital learning programs, professional learning communities, coaching, after-school tutoring, etc.)?
- Fidelity: How consistently do teachers use a particular program or the provided curriculum? Do they know or follow vendor or district-provided recommendations?
- Costs: How much does a given program cost? Is every license being used? From which funding sources does our district pay for this program?
The eROI connection
Understanding these three dimensions of any investment, especially a curricular or instructional one, adds context to the deeper patterns in student achievement you unpack. Without them, you risk cutting a program that may yield excellent results with the right usage, or investing in a resource that doesn’t deliver on its educational promises.
4. Put it all together: Data-informed, human-driven decisions
All of these strategies build to this step and finally answer the question: Is it our curriculum or instruction that needs to change for students to achieve?
The reality is that, even with all the metrics in the world, data alone isn’t going to answer this question for you, nor can it tell you what to do with your investments or which programs to guarantee results. However, the leader equipped with eROI—who also asks the right questions, clarifies the specific student achievement issues to address, and understands how resources are used (as well as their costs)—is best positioned to make the call.
That’s why hundreds of district leaders put their trust in Level Data’s Return On Instruction (ROI) platform.
ROI brings participation, performance, and funding data under one roof for everything from professional learning and coaching to digital tools and programs. Leverage at-a-glance dashboards, in-depth reporting beyond usage, and configurable goals for every investment to understand the academic impact of your educational spending and ensure every student succeeds.
Ready to make human-driven, data-informed decisions? Contact us to learn more.
