Grades carry a lot of weight in K–12 education with students, families, and administrators. But despite being a core responsibility of every classroom teacher, grading itself is not easy. All too often, inaccurate and inconsistent grading slips into classrooms. Grade inflation and deflation can greatly affect students’ learning trajectories as well as their growth opportunities in school and beyond.
This article breaks down what grade inflation and deflation look like in practice, how each negatively impacts student learning, and what administrators can do to mitigate the issue.
How Grade Inflation and Deflation Affects Learners
Grade inflation refers to instances in which students receive grades that do not reflect the learning and growth they actually achieved in the classroom. Conversely, grade deflation means that students receive a lower grade in a class, despite demonstrating greater proficiency or achievement in that content area.
Here’s an example of grade inflation in action. One study by the American Institutes of Research found that, before the pandemic, grades given to middle and high school students in Washington correlated with state assessment scores. This is what most educators would expect—that grades and assessment scores increase or decrease in tandem with one another.
However, after school shutdowns began in 2020, researchers found that the percentage of students receiving A grades radically increased, despite these students scoring in lower percentiles on subsequent state standardized tests. These students likely received inflated grades that did not reflect their true grasp of related content.

Why does this matter?
When a student’s grades do not trend consistently with their proficiency, it sends mixed (or worse, false) signals to the adults in their life about their learning needs, including their teachers, school principals, counselors, and families. As a result, one of two outcomes is likely to occur:
- A student may not receive the resources they need to bolster their learning. As this student faces more complex material in higher grades and beyond K–12, they may struggle academically and fall more and more behind their peers.
- A student may not have access to more rigorous learning opportunities to match their knowledge and skills. They may miss out on more advanced content and coursework, college admissions, scholarship opportunities, and more.
Some arguments link grade inflation and deflation to academic complacency, both from the students and important adults in their lives. For instance, if parents see that their child receives mostly As and Bs, they may not pursue additional learning opportunities such as tutoring, even if the student’s proficiency scores are low.
These phenomena are also related to grading practices that may harm specific student groups in the long run. In particular, Black students, Hispanic students, and students who qualify for free or reduced-priced lunch are most negatively affected by mismatches between grades earned and standardized test scores achieved.
The Gray Areas of Better Grading
With these concerns in mind, it may seem like the solution is simple: ensure students’ grades match actual proficiency. But as anyone with classroom experience can share, improving grading accuracy comes with a lot of gray areas.
First, grading is rarely consistent between teachers and even between schools in the same district. Some tools, like a grading rubric, can reduce these variances and, in turn the likelihood of grade inflation or deflation. Yet few schools create clear, consistent, and rigorous guidelines around grading, and enforcing those rubrics can be tricky.
Second, educators disagree on which approaches to grading most accurately reflect a student’s achievement. Some argue for separating non-academic factors (like attendance) and grades to clarify that grades are purely an academic measure of learning. Others stand against the traditional A to F scale entirely, pointing to more binary options indicating a student’s mastery of content.
Last, teachers, administrators, parents, and even students may not agree on the purpose of grading itself. It can be especially difficult to change grading practices when these perspectives do not align.
3 Actions To Counter Grade Inflation and Deflation
Even with these challenges, administrators have a responsibility to minimize grade inflation and deflation. The trajectory of a student’s future in high school and beyond still greatly depends on grades, so it becomes critical to make grading accurate and consistent.
Here are three steps that a district administrator, principal, or instructional coach can use to:
- Determine if there is potential grade inflation or deflation in an organization.
- Understand the nature of these inaccuracies.
- Strategize how to reduce these instances and improve grading practices.
1. Carefully analyze grades against standardized or screening assessments
This step is crucial for understanding where and how possible grade inflation or deflation may be occurring within an organization.
First, compare students’ class grades against relevant standardized test and universal screening test scores in one content area. Review data at the classroom, school, and district levels to isolate where grading mismatches are occurring.
Here’s an example: An elementary school principal examines all report card data across third-grade math against proficiency scores from NWEA Math. They notice a few unusual trends in their comparison. Of the students assigned an A grade, nine percent were not proficient on the NWEA Math post-assessment. Conversely, of those students who received an F letter grade, three percent were proficient.
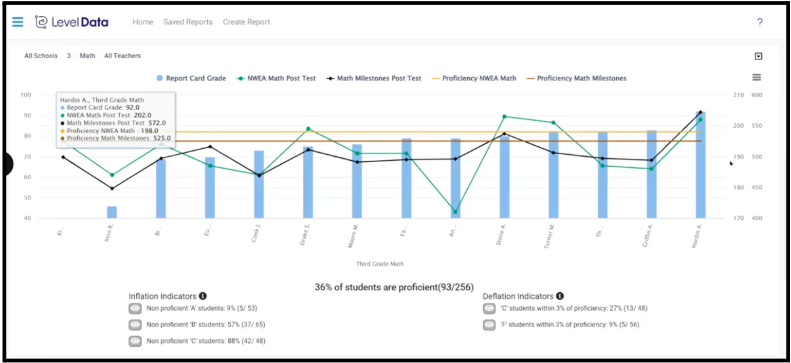
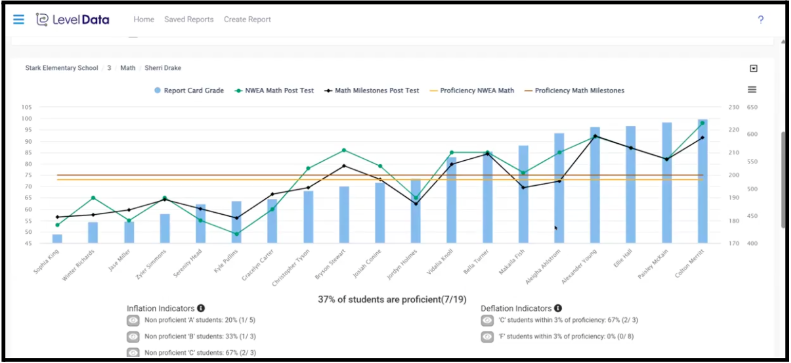
The principal also sees that, in one classroom, some students were not proficient on their NWEA Math post-assessment, yet still earned a letter grade A or B for math on their last report card.
Analyzing class grade data and proficiency scores like these surfaces unusual discrepancies to then investigate more deeply.
Additional Tips
- Consider the degree of possible inflation or deflation in any analysis. The bigger the gap between a grade and its corresponding test scores, the bigger the concern.
- Review these comparisons at least twice per school year, if not more frequently as data become available. This allows teams to make incremental shifts to grading practices throughout the year.
- Invest in a comprehensive digital solution to make these comparisons (and deeper analyses) accurate and accessible. Solutions like Level Data’s Return On Instruction platform house academic achievement, program participation, and program cost data under one digital roof, saving educators invaluable time to focus on addressing the gaps they may uncover in their data.
2. Reinforce a culture of rigorous instruction and consistent grading
Research shows that rigorous instructional and grading practices benefit students, not only in their grasp of a content area in a particular classroom but also in other aspects of school, including attendance and future academic performance.
Data analysis and metrics like the ones above can also help hold a teaching team accountable to higher standards. School leaders can start collaborative conversations with their teachers about data trends they uncover, working with their team to co-create solutions to discrepancies found, such as crafting a rubric for grading practices. At the district level, administrators can use district-wide data to monitor for larger patterns of grade inflation or deflation across schools, then work with school principals on solutions to address the gaps.
Further, school and district leaders can use professional development to drive more rigorous instruction and consistent grading practices among teaching staff. Coaching, for example, can be arranged for specific teachers who may benefit from support in specific instructional areas or for entire schools that are changing their grading practices.
Did you know? Our Grow platform streamlines instructional coaching by centralizing feedback, observations, and coaching resources, all in one place. Request a demo to learn more.
3. Verify curricula and assessments are aligned
Though rare, grade inflation and deflation sometimes stem from a mismatch between the content taught in a classroom and the content assessed. District and school leaders may need to double-check their instructional resources against their assessment tools.
For example, a district administrator could compare district-wide student proficiency data between NWEA Math and their state math assessment to see how scores trend by grade or specific content area. If class grades do not follow similar trends at this larger scale—meaning, many students are receiving much higher or lower grades relative to their proficiency scores—the district should verify that the curricula used in these areas map back to the standards tested.
Though complex, tackling grade inflation and deflation is essential to ensure that all students have access to the right learning resources and the greatest opportunities to thrive, both inside the classroom and beyond. The Return on Instruction platform triangulates costs against resource usage and student academic data, letting district leaders make fiscally informed, financially responsible decisions to solve issues like grade inflation or deflation. Request a demo today!
