Take the Guesswork Out of Educational Spending With Holistic K–12 ROI Analysis
Can you confidently pinpoint which of your instructional investments has a positive impact on student learning? If the answer is “No,” you’re not alone. Calculating the return on investment of K–12 spending is not a simple ratio of profit to cost; it’s a nuanced calculation about the financial impact on student achievement.
Yet, most K–12 analytics programs only focus on digital engagement of edtech tools, failing to measure broader instructional investments, such as:
Teacher Training

Core Curriculum

Digital Learning Platforms

Support Programs
Level Data’s Return on Instruction (ROI) platform goes beyond logins and clicks to measure what matters most: whether student outcomes improved as a result of specific tools or resources.
Calculate K-12 ROI to Support Data-Driven Decision Making
Our advanced Return on Instruction (ROI) algorithm was developed by educational consultants with decades of experience working alongside districts on continuous improvement plan strategy and execution. It’s through that lens that ROI works to connect participation data to cost, isolate variables, and correlate multiple performance indicators so district leaders can make strategic budgeting decisions.
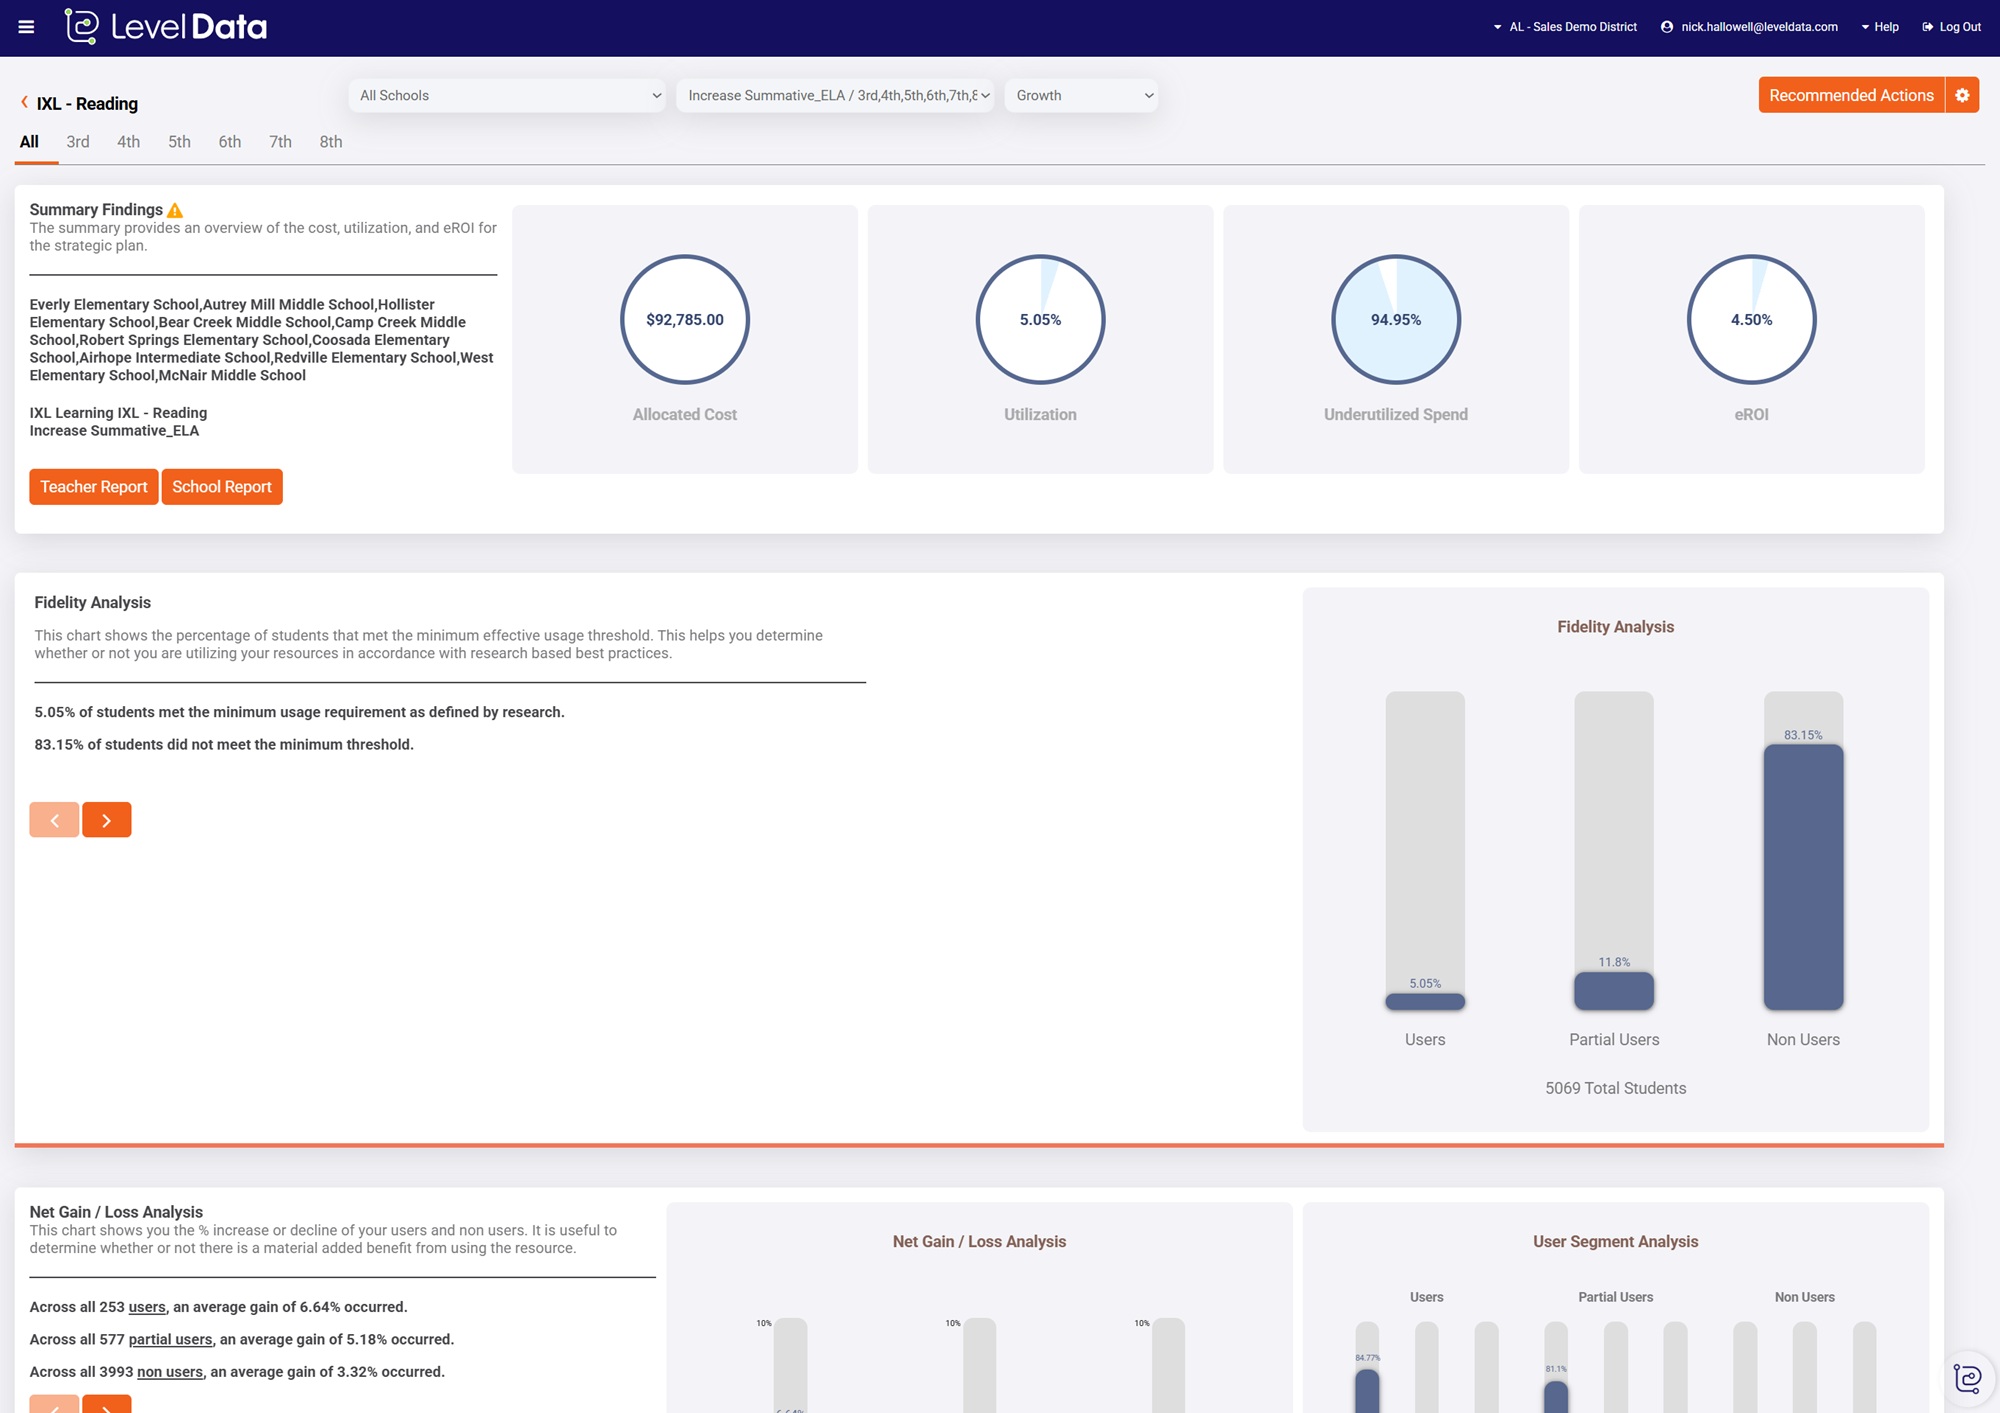
Visualize Usage, Impact, and ROI in One View
Uncover how instructional investments are driving outcomes by visualizing product spend alongside student utilization and growth to identify what’s working — and what’s not. Pinpoint underutilized tools, highlight classrooms making the most of their resources, and quantify return based on actual learning gains.
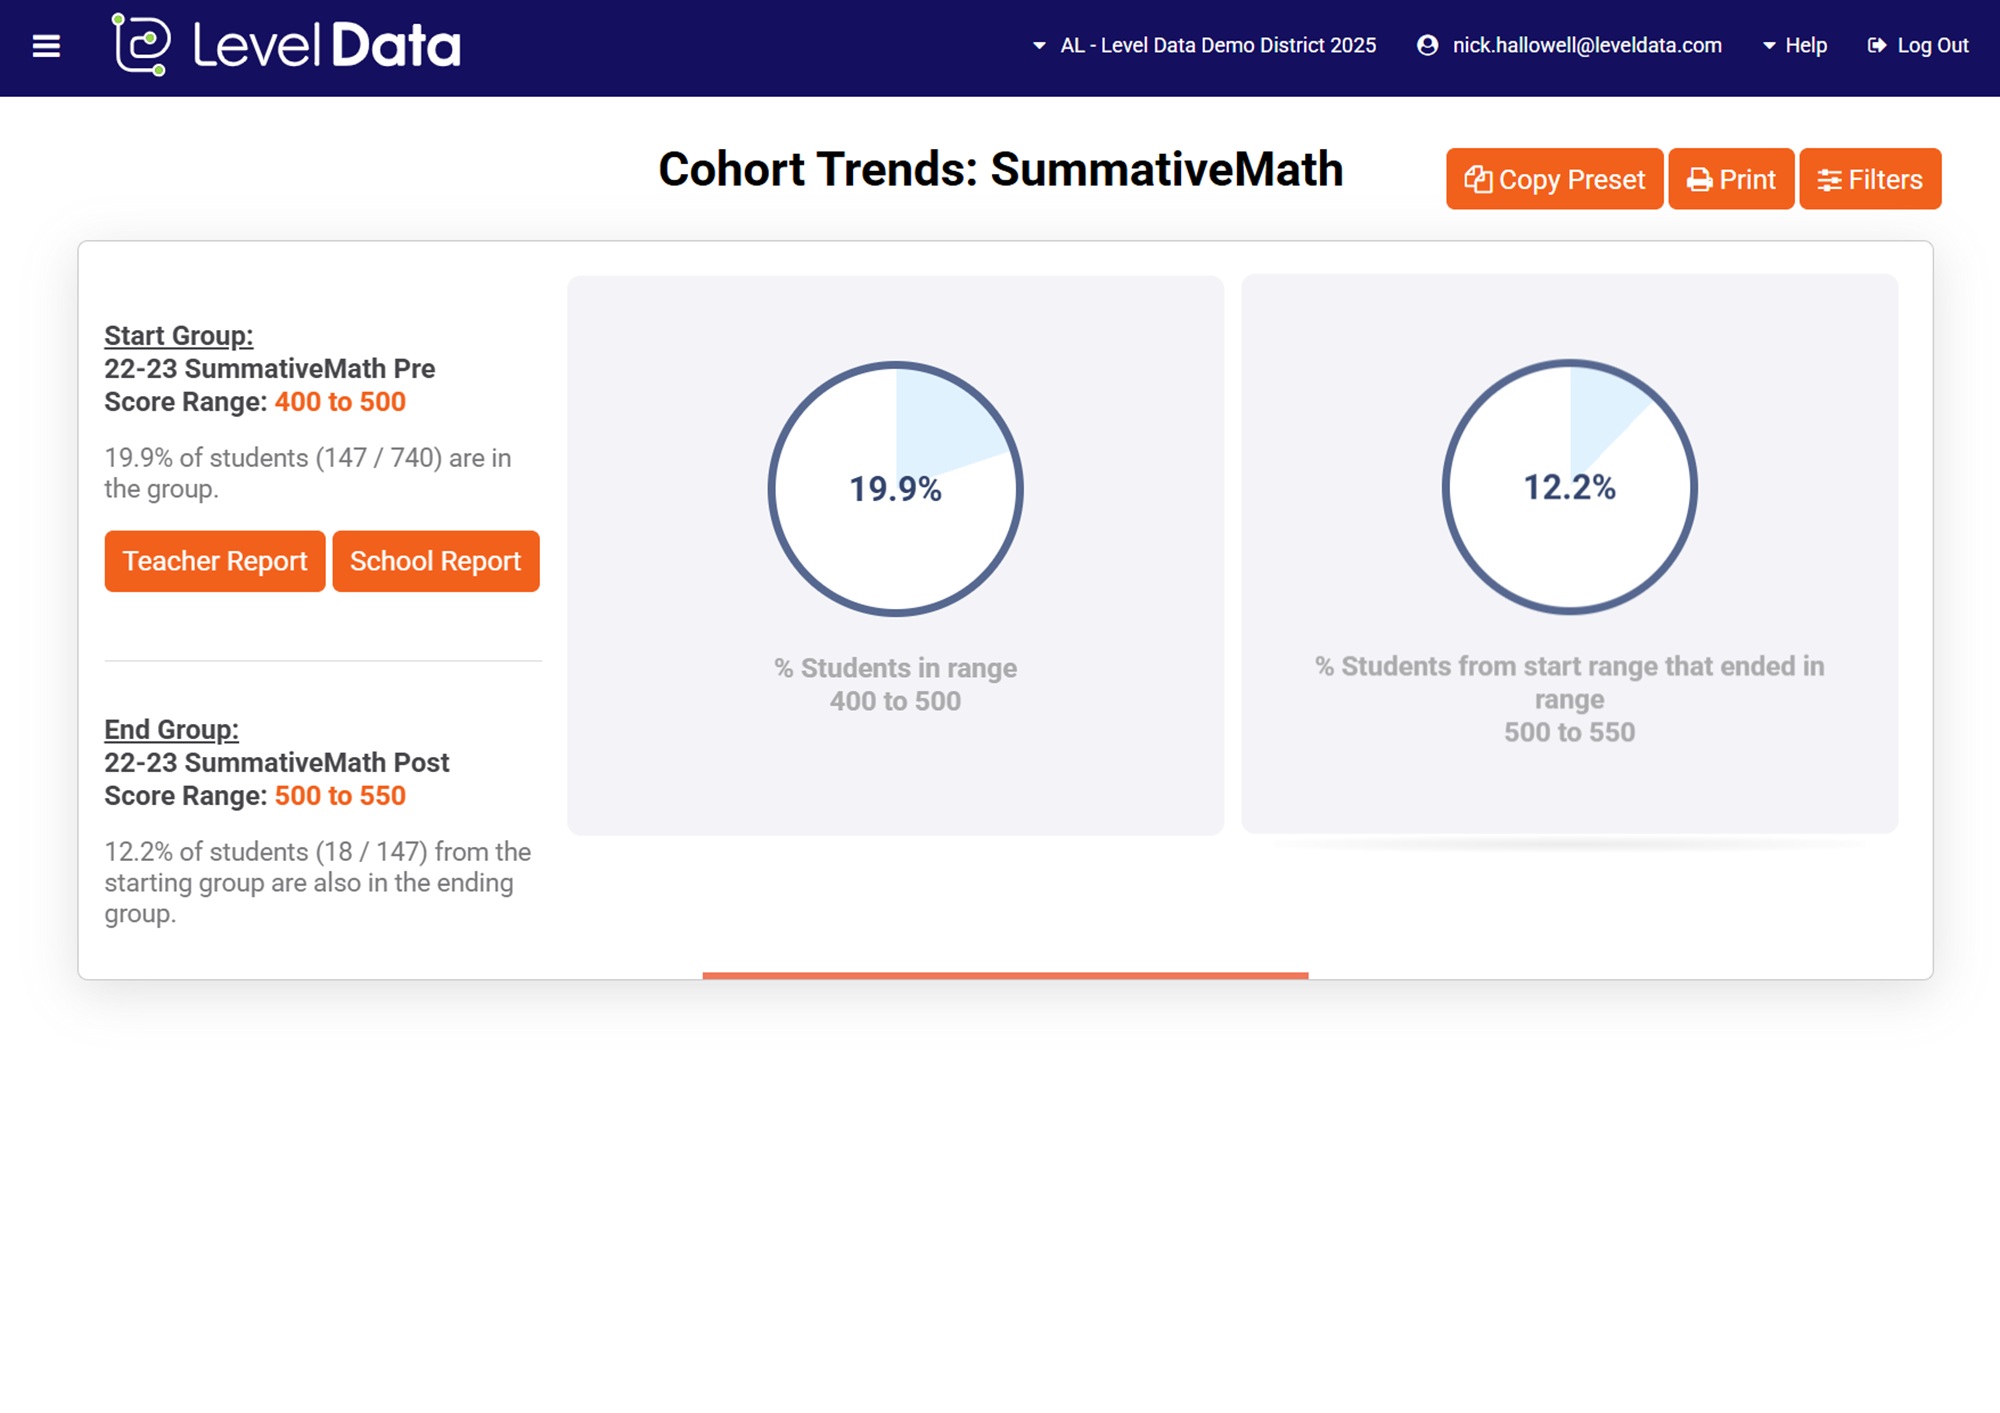
Drive Continuous Improvement with Subgroup Performance Insights
Whether you’re tracking progress for multilingual learners, students with disabilities, low-income students, or any other federally recognized subgroup, ROI helps district teams disaggregate outcomes and gain insight into:
- Trends and gaps in access, engagement, and outcomes by cohort, grade, or program
- Whether investments are aligned with your continuous improvement plans
- How to reallocate resources where they’ll have the greatest impact

Unlock the Full Value of Your Core Instruction
Strong core instruction is the foundation of student success, and your district’s biggest investment. ROI’s academic reports provide deep insight into how investments in Tier 1 curriculum, instruction, and professional learning can be better optimized to support student growth and reduce the number of students needing costly Tier 2 and Tier 3 interventions.

Create a Shared K–12 ROI Vocabulary for the Entire District Cabinet
Decisions about district priorities are not made in a vacuum, but sometimes the purchases to support those priorities are. Measuring the return on investment of K–12 investments helps bring superintendents, curriculum leads, federal program directors, and technology directors into alignment with shared, real-time-insights.

Strengthen fiscal responsibility by aligning investments with district-wide strategic goals.

Generate real-time evaluation evidence to justify and guide spending of federal dollars on resources and initiatives.

Increase spending on the most successful applications by analyzing product usage, growth rates, learning loss, and proficiency by cohorts.

Determine whether edtech tools are being utilized as intended or if underutilization is resulting in wasted resources.
Hear How Florida’s 8th Largest District Measures the Financial Impact on Student Achievement.
Trusted by District Leadership Teams Across the Country
We chose Level Data to measure ROI for our Title I program to provide a clear, actionable view of how our digital and non-digital resources impact student outcomes. From software tools to in-person tutoring, family engagement, and other support initiatives, ROI helps us assess what’s working, ensuring every Title I dollar is used as effectively as possible.
ROI helped us reframe the question—not whether the program worked, but how well we were implementing it.
Initially, the goal was about setting the bar for curriculum performance and ensuring consistency across the district. But, the ability with ROI to drill down into specific student groups has been a game changer for us.
The district needed something to guide them and give them rich data to make the best decisions. Now with ROI (formerly Glimpse), we have the data and know what to do with it. This is a place everyone from my team can go in and grab what they need to achieve our goals and our student goals.
Whether in times of plenty or financial challenge, we have a responsibility to be good stewards of the community’s tax dollars. It’s essential that we make informed decisions about how we allocate those funds and ensure the community that we’re acting in the best interest of their children. ROI helps us do that.

At the forefront, student success is really important to us. Being great stewards of our taxpayer dollars is also essential. When I saw that there was an opportunity to look at multiple data points and evaluate our return on investment, I knew this tool could help us achieve our goals. It speaks directly to improving student success and ensuring we are using taxpayer dollars effectively.
Return on Instruction provides us with the needed data to ensure we’re providing our students with the best supports possible for their academic achievement. Plus, their customer service is exceptional.
K–12 ROI Resources